How to calculate basic EPS(Earnings Per Share) from EDGAR API with pandas

Today I will show you how to calculate a financial metric called basic Earnings Per Share (EPS).
Click here if you are not sure what EPS is.
Imagine a pie representing a company's profits. Divide this pie into slices, each representing one share of the company. The size of the slice is EPS. Bigger the slice (higher EPS) - the better the company is doing.
I calculate EPS when I would like to get some insights on profitability trends and benchmark it against competitors.
We will fetch the company facts data from the EDGAR API and perform a calculation based on the following formula:
\[ EPS = \frac{Net Income - Preferred Dividends}{Average Common Shares Outstanding} \]
My notes on EPS:
- As you can see from the formula inputs - liabilities are not considered, so using EPS alone might be not optimal for your use case.
- If the company buys back stock, decreasing the denominator, you can observe higher EPS without an increase in earnings.
A small note before we start to calculate EPS. There are commercial APIs and free applications that can provide you with EPS values.
We will use Alphabet for our example. Its CIK number is 1652044. It does not have preferred dividends, using field names from EDGAR response EPS formula will be:
\[EPS = \frac{NetIncomeLoss}{CommonStockSharesOutstanding}\]
The code is listed below and in a Google Colab.
You can read explanations after the code.
get_company_facts gets json from the EDGAR API.
get_fact returns dataframe with value and end period as pandas datetime.
As you can see, sizes of net_income_loss and shares_outstanding dataframes are different.
filter_facts returns only quarterly and yearly values from the row's financial year. You can pass an accession number accn if you are interested in a specific filing.
We would like to get a single value for each quarter. In the first 3 quarters, companies submit 10-Q forms with quarterly values. In the last quarter, they submit 10-K for the whole year.
We will subtract the sum of the first 3 quarters from yearly values to get Q4 data.
For that, in get_quarterly_net_income_loss we create periods dataframe with get_periods function and perform a left merge with the income dataframe on ['end', 'start']
Now sizes of shares and income dataframes are equal and we merge them together into eps dataframe.
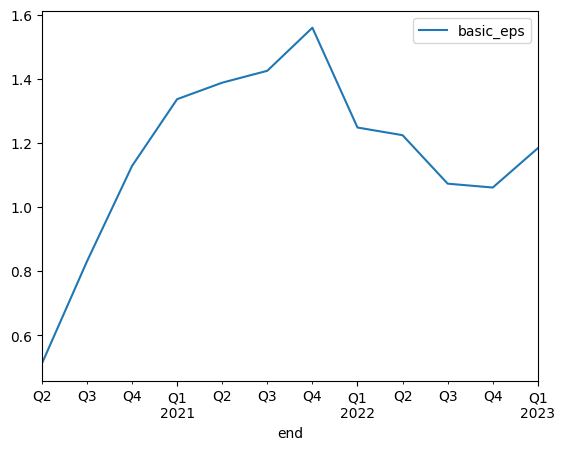
We calculate earnings per share and see a sudden drop in it in Q2 2022.
It is when Alphabet made a 20 for 1 stock split.
We divide EPS before Q2 2022 by 20 to account for a stock split.
In production, you might want to keep track of cumulative multiple accounting for all stock splits.
Then we plot the basic eps.
Thank you for reading.